
Power your team’s performance with one comprehensive resource.
Enhance scouting, player development and team communication with our database of video and data.
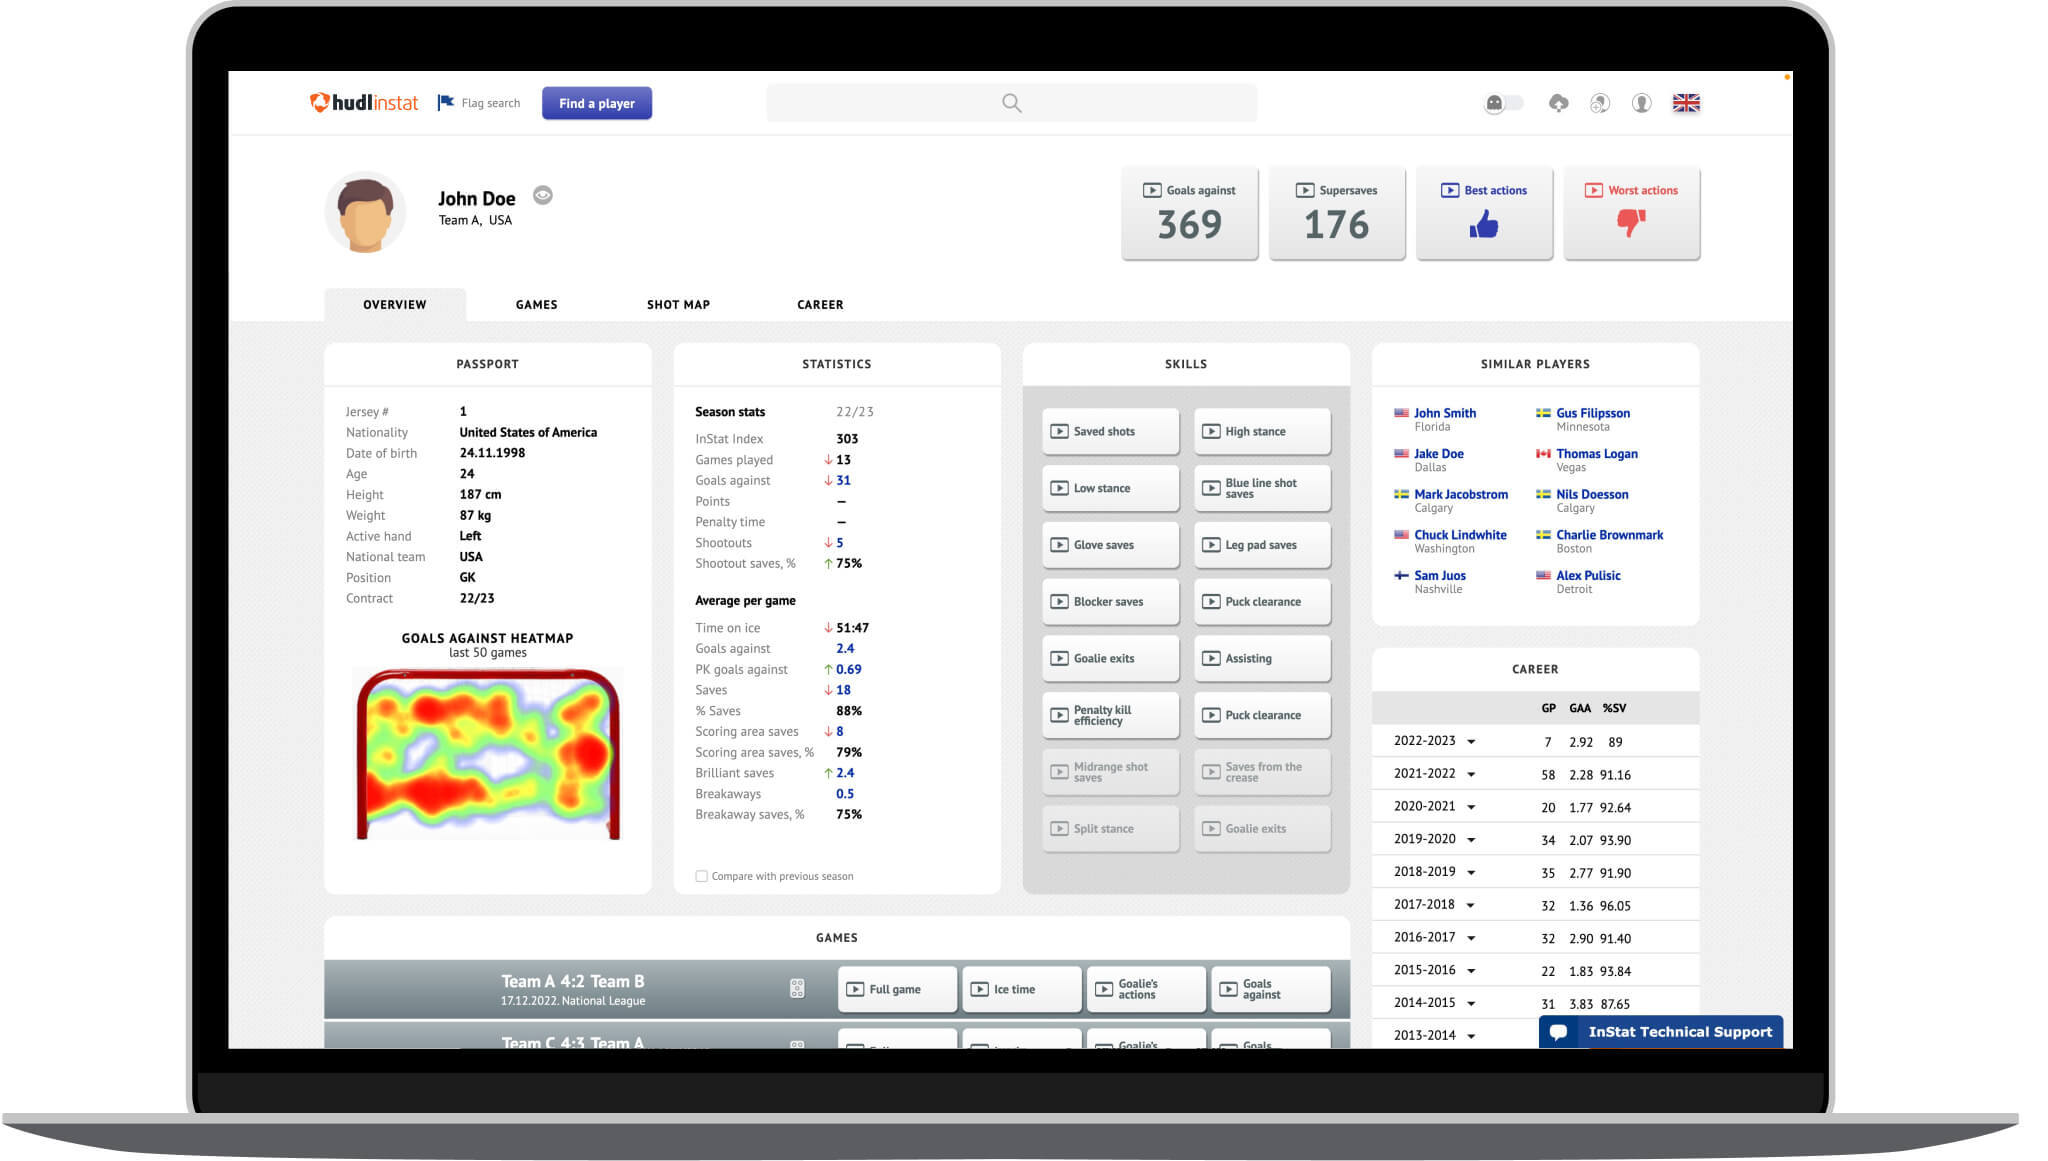
In-depth video library with games from top leagues around the world
Best-in-class statistics
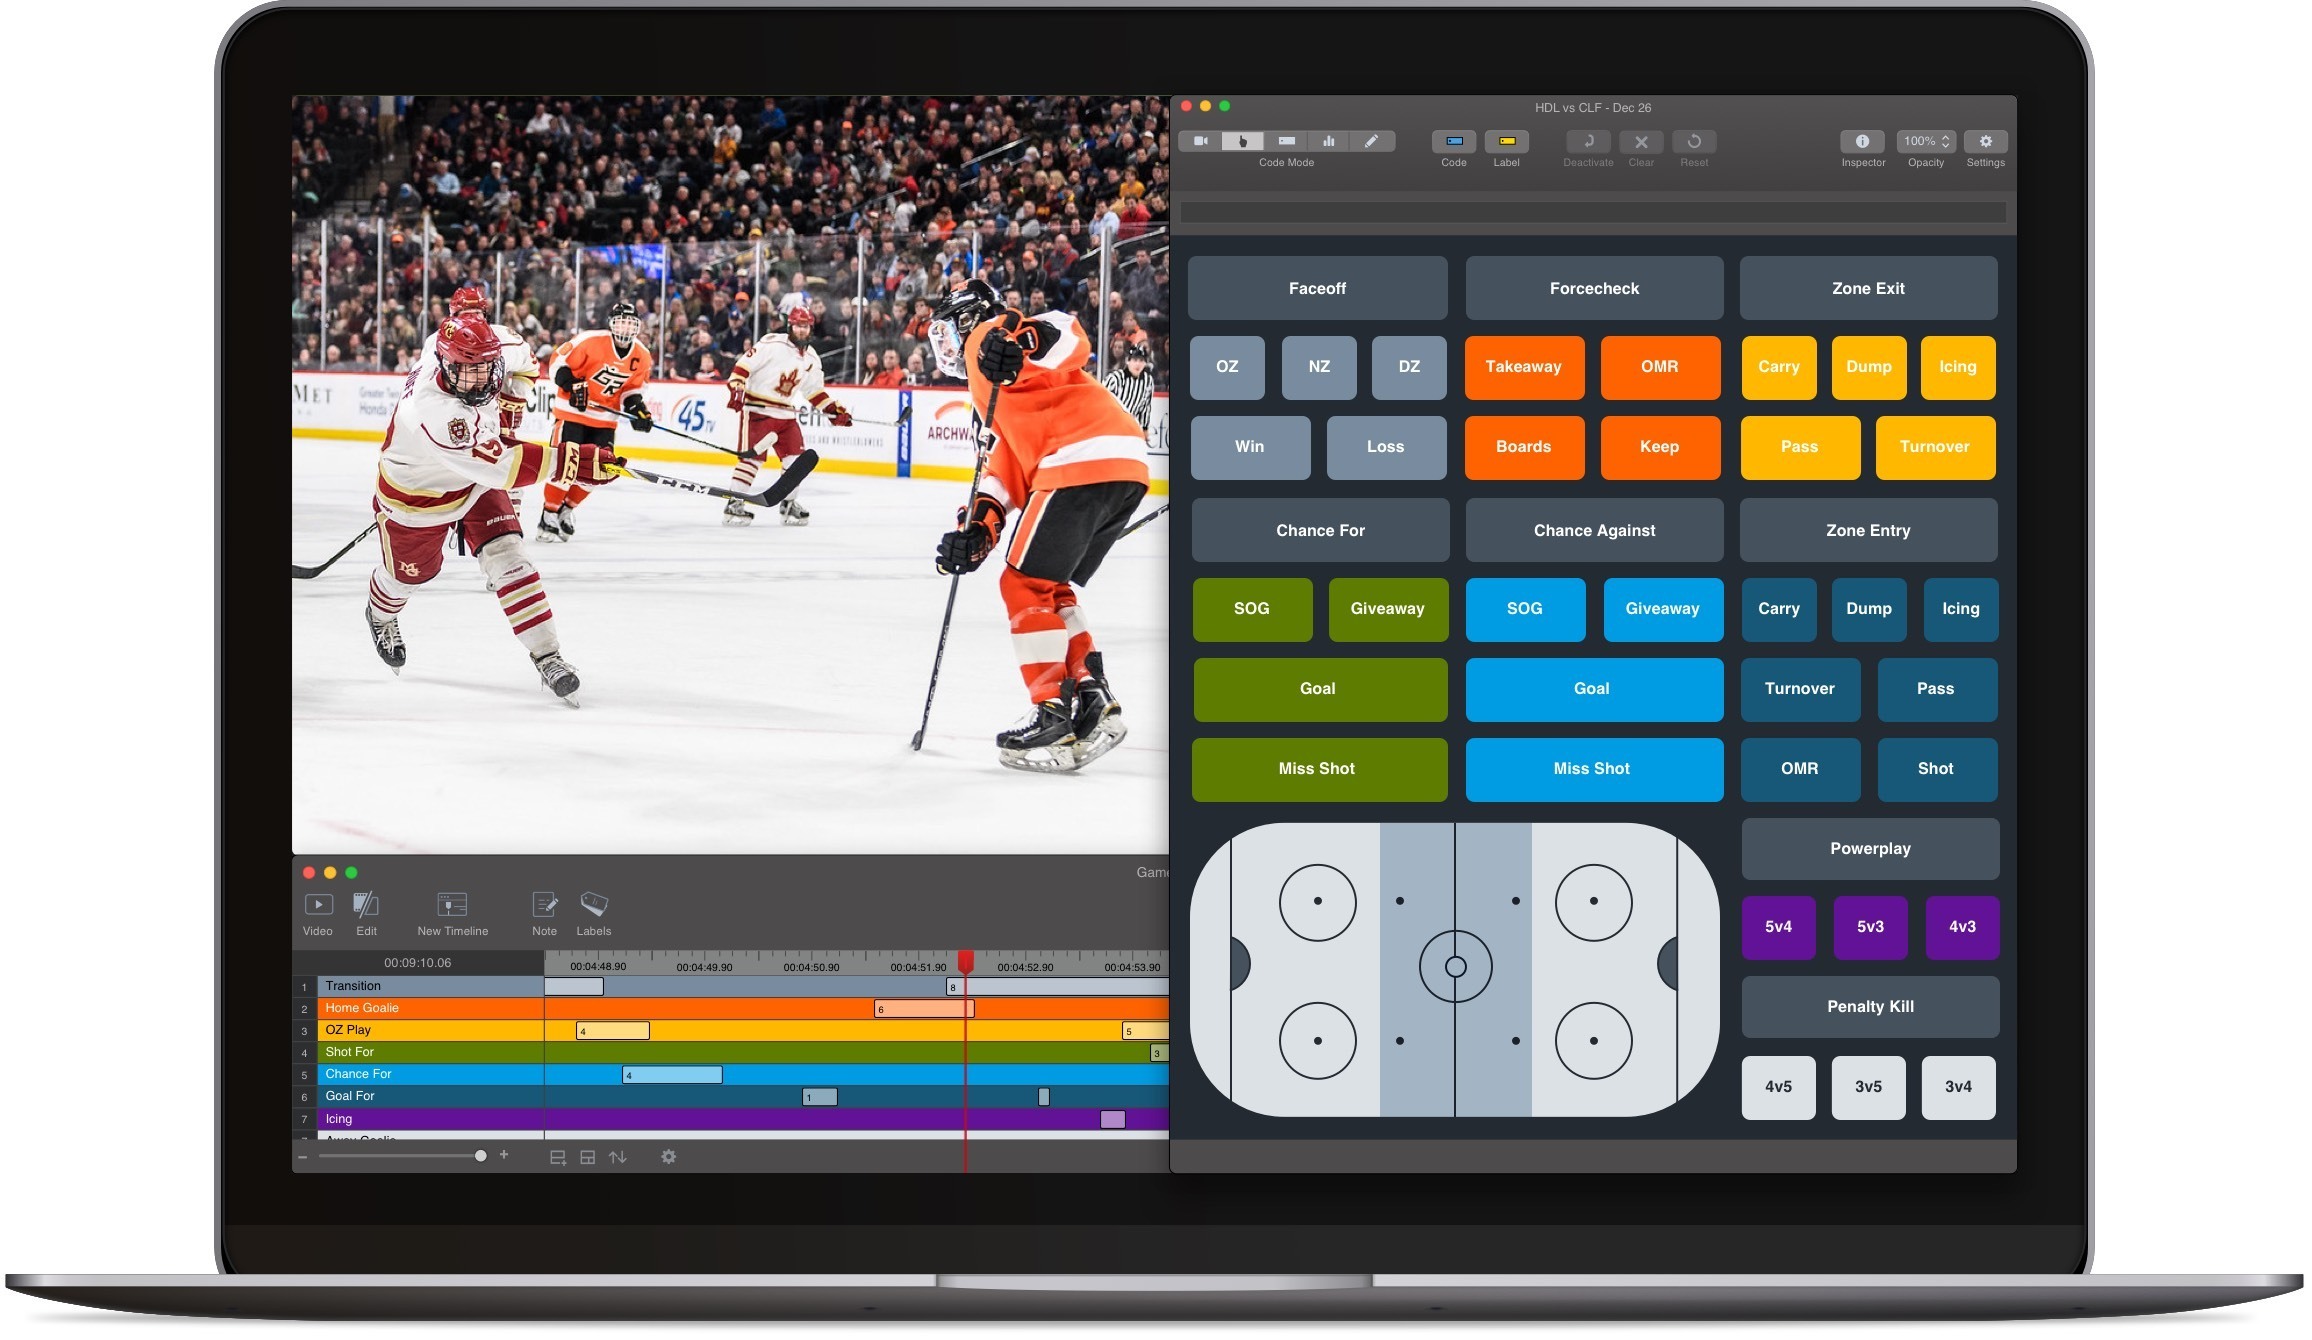
Sync video directly from Hudl Instat with Hudl Sportscode and Studio.
Analysis Solutions
Analysis for every workflow.
Online, offline and real-time video and data tools.
Powerful coding tools
Customized scripting capabilities
Video review from any device

Distribution Solutions
Effortless asset management.
Share data and video from a secure, cloud-based platform.
Connect the entire team
Cultivate consistency
Connect your league

“Hudl has been a vital part of our team's success in the NHL for years. The software increases our productivity through the ability to instantly generate reports, all while organizing and labeling high quality video.”
Brett Leonhardt
Assistant Coach, Washington Capitals
Streamline your workflow.
Connect with our team by filling out this form.